Network Monitoring Dashboard
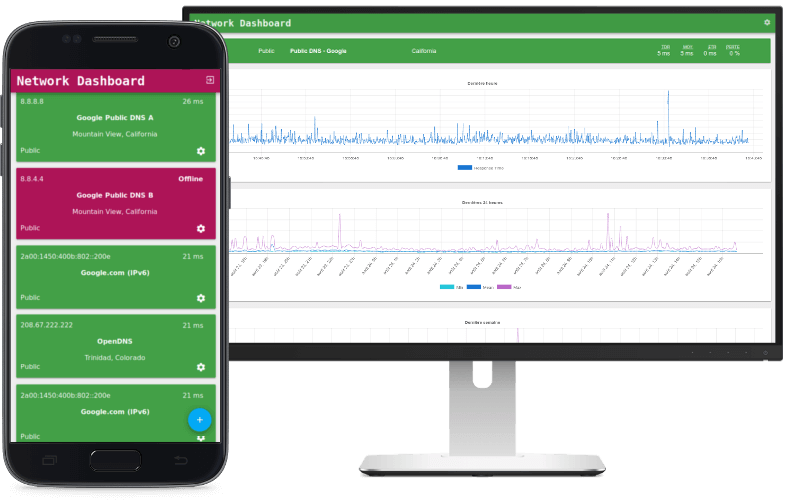
“Network Dashboard” is a network monitoring tool I built for an Internet Service Provider (ISP) called Xankom. It allows them to see an overview of their network's state an to quickly react to issues. It was built with Node.js and Angular.
About the Project
Xankom is an Internet Service Provider startup in Brittany, France. They are particularity popular with small to medium businesses as they offer a broad variety of services and excellent support. Xankom also operates their own backbone using long range WiFi to bring broadband to underserved areas.
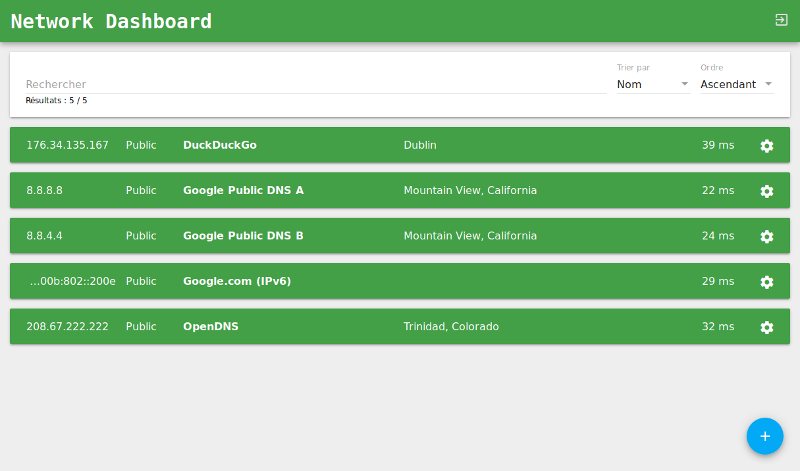
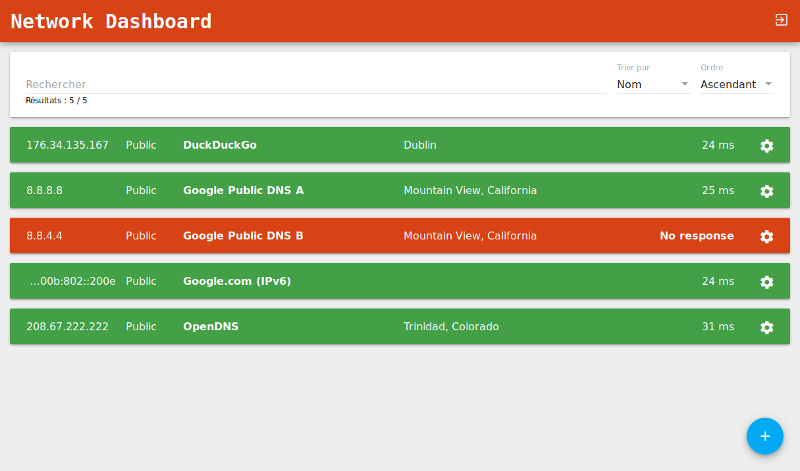
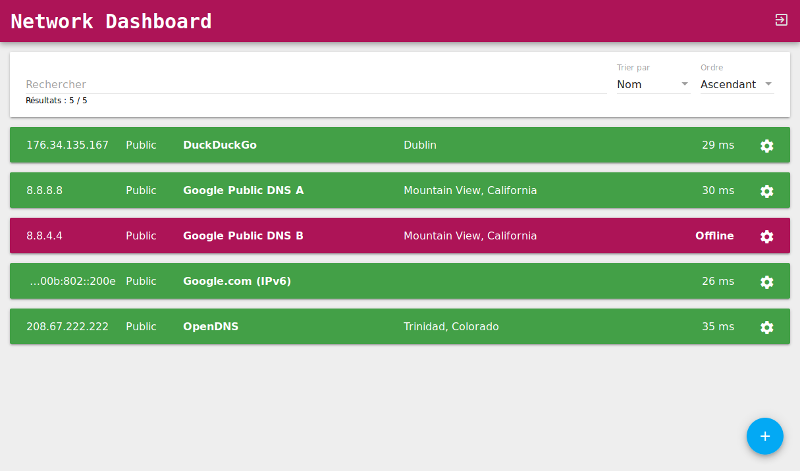
Initially, I developed the Network Dashboard to provide a simple overview of important network nodes. I was especially interested in making it easy to use on mobile devices (for in-field engineers) and monitoring screens in Xankom’s offices as existing tools where not optimal. SMS and Email alerts where also an important feature. Due to it’s popularity the the tool has been expanded and is now being used to monitor a variety of devices both inside and outside the network.
Technical Details
The Network Dashboard interface is built with Angular and the backend uses Node.js with time-series data stored in InfluxDB. Node.js was chosen for it’s event driven model and capability to handle streaming data. Similarly, Angular and the SPA design is perfectly suited to the real time nature of the app.
Architecturally the app is divided into three parts; clients, the server and agents. The client is the web interface which network admins use monitor devices and manage configuration. Clients connect to the server via an API and receive real time data over a WebSocket. The server stores configuration and provides APIs for agents as well as clients. When agents connect to the server they receive a list IP addresses to monitor and they stream the results back to the server. The server in turn analyses the data, stores it for graphing and streams it to any connected clients.